Concept and design
In a previous video I made going over the different Multi WAN modes. I spoke about how you could route traffic over different WAN connections to create a form of load balancing. We can use that same concept for monitoring multiple WAN connections from a single monitoring application.
In this guide, I will be using a monitoring application called “Uptime Kuma” mainly due to it being quick to install and extremely simple to setup. However this method will work for any monitoring software that uses a ping (ICMP) to monitor a devices presence.
Installation
I have created an Ubuntu server VM that is on the “Management” network. I have given it a static IP of ```10.0.0.3
From there I have created an "Uptime Kuma" container that is ready to go.

I simply create a folder in my users home folder called ```docker```
and then created a folder in there called ```kuma```

In the ```kuma``` folder, I then created a file in there called ```docker-compose.yml``` and a folder called ```data```. That is where all the data Uptime Kuma needs to store will go.


Below is the docker-compose.yml file I used to get it running:

``` YML
version: '3.3'

services:
  uptime-kuma:
    image: louislam/uptime-kuma:1
    container_name: uptime-kuma
    volumes:
      - ./data:/app/data
      - /var/run/docker.sock:/var/run/docker.sock:ro
    ports:
      - 3001:3001  # <Host Port>:<Container Port>
    restart: always
Once done, we can simply run the following:
sudo docker-compose up -d
That will create and start the container.
Create the monitors
Once Uptime Kuma is up and running, we can goto:
http://<your.servser.IP>:3001
in your web browser of choice and we can create the following monitors. Change the <your.servser.IP> to the IP of your server.
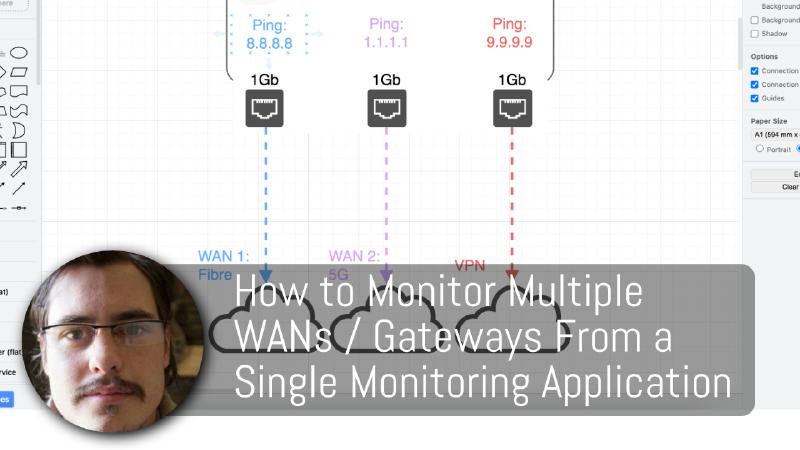
For this guide, we will create three monitors.
- For the first WAN, we will call it Fibre
- For the second WAN, we will call it 5G
- For the VPN, we will call it VPN
Create a monitor
Click on the
+ Add New Monitorbutton on the top left to start creating a new monitor.Use the following:
Monitor Type: ping
Friendly Name: "Fibre"
Hostname: 8.8.8.8
Heartbeat Interval: 60
Retries: 2
Heartbeat Retry Interval: 20
Description: "Fibre WAN Uptime"
Click the
savebutton at the bottom to add the monitor.Now repeat this two more times, using the following:
Monitor Type: ping
Friendly Name: "5G"
Hostname: 1.1.1.1
Heartbeat Interval: 60
Retries: 2
Heartbeat Retry Interval: 20
Description: "5G WAN Uptime"
Monitor Type: ping
Friendly Name: "VPN"
Hostname: 9.9.9.9
Heartbeat Interval: 60
Retries: 2
Heartbeat Retry Interval: 20
Description: "VPN Uptime"
Test that the monitors work
Now since the server is on the “Management” network. The pings will most probably use the default WAN mode that you have set for that network. So in this instance it is on a “failover” WAN group that uses the “Fibre” WAN first and the “5G” WAN as the failover.
So if we unplug the “Fibre” connection, we should see that all the connections will be marked as down for a few moments, until the failover kicks in.
This will let us know that the monitor are working, however we want to have the monitors monitor the desired individual WAN connections.
We will do that on our Firewall by creating rules in order to route the pings through the correct WAN connection / Gateways.
Firewall rules.
This is not an “OpnSense” specific feature. This will work with any firewall where you have the ability to create detailed firewall rules. You will just need to consult the user manual for that firewall in order to see how to create custom rules.
However, in this guide I will use OpnSense as my firewall.
Firewall rule concept
The rule will allow ICMP traffic to Pass from the server with IP <your.server.IP> through a specific Gateway depending on the destination IP
- Login to your Firewall.
- In OpnSens, I will go to the “Management” network in the “Rules” section and create a new rule.
- Use the following but change it to suit your setup.
Action: Pass
Interface: <Your Network Name>
Direction: in
TCP/IP Version: IPv4
Protocol: ICMP
ICMP Type: any
Source:  Single host or Network
<your.server.ip> / 32
Destination:  Single host or Network
<ping.to.ip> / 32
Log: enabled (Optional)
Description: Ping for Fibre Monitoring
Gateway: <Your Desired WAN Connection>
So for this guide / my network it will be the following:
Fibre Uptime Monitoring:
Action: Pass
Interface: Management
Direction: in
TCP/IP Version: IPv4
Protocol: ICMP
ICMP Type: any
Source:  Single host or Network
<your.server.ip> / 32
Destination:  Single host or Network
8.8.8.8 / 32
Log: enabled (Optional)
Description: Ping for Fibre Monitoring
Gateway: <Your Desired WAN Connection>
5G Uptime Monitoring:
Action: Pass
Interface: Management
Direction: in
TCP/IP Version: IPv4
Protocol: ICMP
ICMP Type: any
Source:  Single host or Network
<your.server.ip> / 32
Destination:  Single host or Network
1.1.1.1 / 32
Log: enabled (Optional)
Description: Ping for 5G Monitoring
Gateway: <Your Desired WAN Connection>
VPN Uptime Monitoring:
Action: Pass
Interface: Management
Direction: in
TCP/IP Version: IPv4
Protocol: ICMP
ICMP Type: any
Source:  Single host or Network
<your.server.ip> / 32
Destination:  Single host or Network
9.9.9.9 / 32
Log: enabled (Optional)
Description: Ping for VPN Monitoring
Gateway: <Your Desired WAN Connection>
With those rules created and applied, we can test again and we should now get the desired results.
Test that the monitors work individually
If we now unplug the first WAN connection in this case the “Fibre” WAN. We will see that only the “Fibre” monitor will show as “down”.
If the “VPN” connection was connected on the “Fibre” WAN, that too will show as “down” until it reconnects to the next WAn connection.
If we plug it back in, the monitor will return to “UP”.
You can now do this test on the “5G” WAN and you should get the expected results.
Conclusion
This was a quick guide showing you how to monitor multiple WANs / Gateways using a single instance of your monitoring software. The power of firewall rules helps you achieve this setup and is a very quick and flexible option that doesn’t require complicated network setups.